ELK5离线日志帮助实例
本文基于5.4版本搭建, 涉及到组件elasticsearch-5.4.3/filebeat-5.4.3-linux-x86_64/kibana-5.4.3-linux-x86_64/logstash-5.4.3, 这里不做功能、安装作介绍, 对应资料请查询详细的官方文档.
相关官方参考资料
1. 需要检索的log4j日志实例
2017-07-10 00:00:01,352 INFO http-nio-8681-exec-6 (org.apache.cxf.interceptor.LoggingInInterceptor:250) - Inbound Message
----------------------------
ID: 138366
Address: http://api.test.com/v1/user/login
Encoding: UTF-8
Http-Method: POST
Content-Type: application/x-www-form-urlencoded
Headers: {accept-encoding=[gzip], connection=[close], Content-Length=[193], content-type=[application/x-www-form-urlencoded], host=[api.test.com], remoteip=[0.0.0.0], user-agent=[Dalvik/1.6.0 (Linux; U; Android 4.1.2; GT-I9300 Build/JZO54K)], x-forwarded-for=[0.0.0.0, 0.0.0.0], x-real-ip=[H]}
--------------------------------------
2017-07-10 00:00:01,352 INFO http-nio-8681-exec-10 (com.test.interceptor.AuthFilter:138) - execute[/v1/user/login]spend time : 1
2017-07-10 00:00:01,353 INFO http-nio-8681-exec-6 (org.apache.cxf.jaxrs.utils.FormUtils:173) - model=GT-I9300¶m1=¶m2=13065ffa4e3f3e2dd57¶m3=2¶m4=20¶m5=4.1.2¶m6=aaba106c520ef01e¶m7=1.0.3¶m8=_360¶m9=10001
2017-07-10 00:00:01,367 INFO http-nio-8681-exec-4 (com.test.interceptor.AuthFilter:85) - request url : /v1/user/logout, params : {param3=2, param5=4.1.2, pos=0, param9=10001, param1=, param2=13065ffa4e3f3e2dd57, param8=_360, model=GT-I9300, param6=aaba106c520ef01e, param7=1.0.3, param4=20}
2017-07-10 00:00:01,368 INFO http-nio-8681-exec-4 (org.apache.cxf.interceptor.LoggingInInterceptor:250) - Inbound Message
----------------------------
ID: 138367
Address: http://api.test.com/v1/user/logout
Encoding: UTF-8
Http-Method: POST
Content-Type: application/x-www-form-urlencoded
Headers: {accept-encoding=[gzip], connection=[close], Content-Length=[199], content-type=[application/x-www-form-urlencoded], host=[api.test.com], remoteip=[0.0.0.0], user-agent=[Dalvik/1.6.0 (Linux; U; Android 4.1.2; GT-I9300 Build/JZO54K)], x-forwarded-for=[0.0.0.0, 100.109.0.167], x-real-ip=[100.109.0.167]}
--------------------------------------
2. 分解日志,写出我们grok的表达式
log4j pattern
log4j.appender.test.layout.ConversionPattern = %d %5p %t (%c:%L) - %m%n
从上文日志实例中看出, 一条log4j消息:
2017-07-10 00:00:01,352 INFO http-nio-8681-exec-10 (com.test.interceptor.AuthFilter:138) - execute[/v1/user/login]spend time : 1
对应的组成即可理解成:
${datetime} ${logLevel} ${THREAD_NAME} (${CLASS_NAME}) - ${OUT_MESSAGE}
生成对应的grok表达式(grok表达式调试地址)
(?m)%{TIMESTAMP_ISO8601:timestamp}\s*%{LOGLEVEL:level}\s*(?<THREAD_NAME>[a-z0-9-]*)\s*\((?<CLASS_NAME>[a-zA-Z0-9\.]*:\d*)\)\s*\-\s*(?<OUT_MESSAGE>.*?)\s*^(\d{4}-\d{2}-\d{2}\s*\d{2}\:\d{2}\:\d{2},\d{3})
3. 配置启动elasticsearch
单机版不更改默认的elasticsearch配置
#启动elasticsearch, 后台启动
./bin/elasticearch -d
4. 配置启动kibana
#./config/kibana.yml
server.port: 5601
server.host: "${eth0:IPAddress}"
elasticsearch.url: "http://localhost:9200"
kibana.index: ".kibana"

#启动kibana
./bin/kibana
5.配置启动logstash
#定义一个管道文件./first-pipeline.conf
input {
    beats {
        port => 5044
    }
}
filter {
    grok {
        match => [ "message", "%{TIMESTAMP_ISO8601:timestamp}\s*%{LOGLEVEL:level}\s*(?<THREAD_NAME>[a-z0-9-]*)\s*\((?<CLASS_NAME>[a-zA-Z0-9\.]*:\d*)\)\s*\-\s*(?<OUT_MESSAGE>.*)"]
    }
}
output {
    elasticsearch {
        hosts => [ "127.0.0.1:9200" ]
        index => "api-ttt"
    }
}

#启动logstash, 动态加载配置
./bin/logstash -f first-pipeline.conf -r
6.配置启动filebeat
#./filebeat.yml, 默认勘探是不开启多行模式
filebeat.prospectors:
- input_type: log
  paths:
    - /home/test/test/log/*/testFile*
  multiline.pattern: ^(\d{4}-\d{2}-\d{2}\s*\d{2}\:\d{2}\:\d{2},\d{3})
  multiline.negate: true
  multiline.match: after
output.logstash:
  hosts: ["localhost:5044"]

#启动filebeat
./filebeat -e -c filebeat.yml -d "publish"
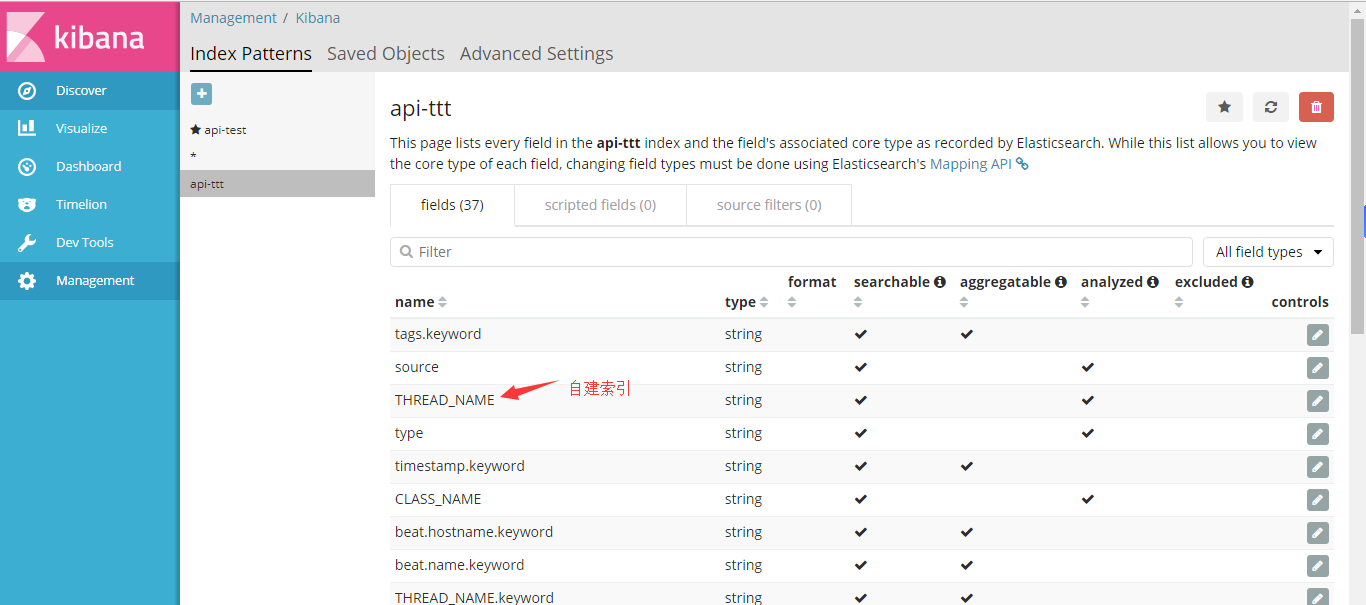
7.kibana检索
访问之前安装的kibana服务地址, 如http://192.168.1.84:5601
访问索引api-ttt(上文logstash建立)
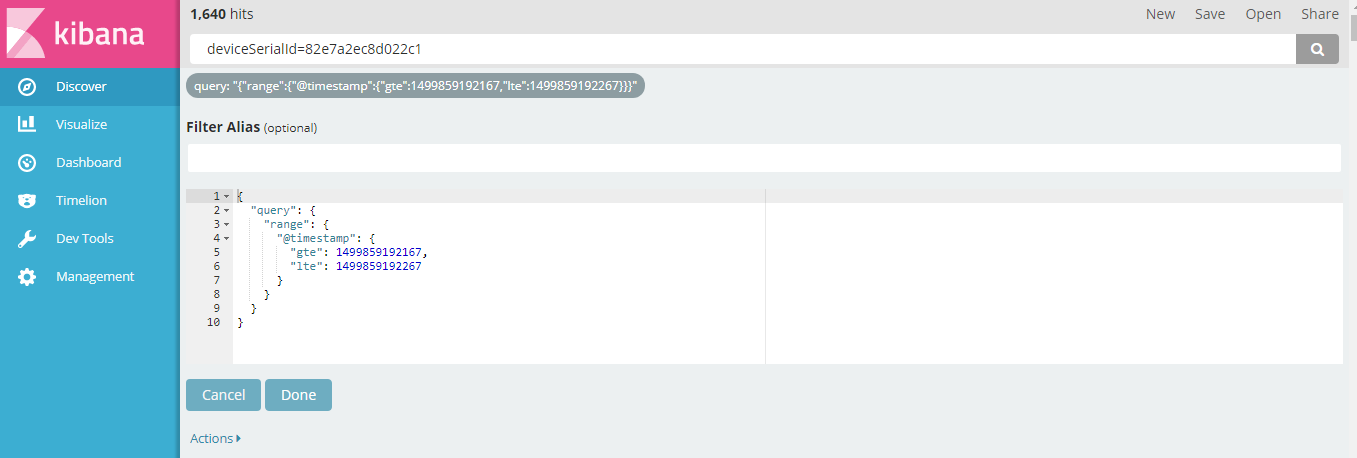
输入检索条件,根据用户设备号与时间区间快速的定位日志
((elasticsearch DSL语法))
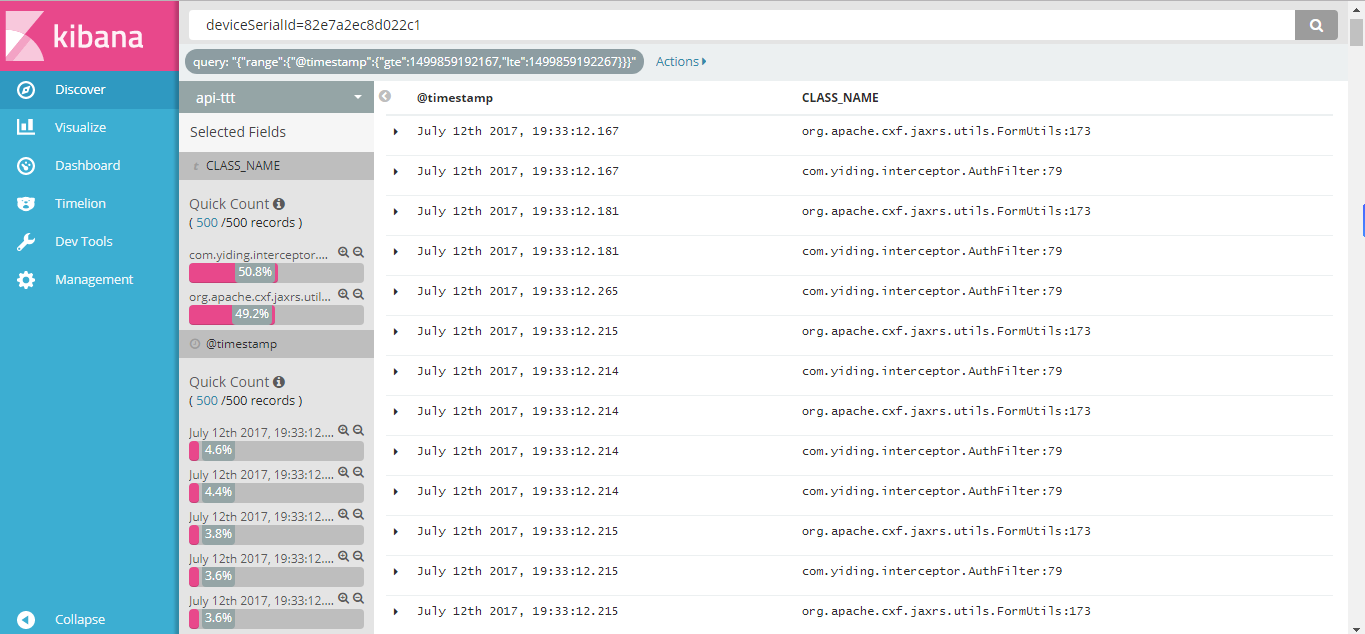
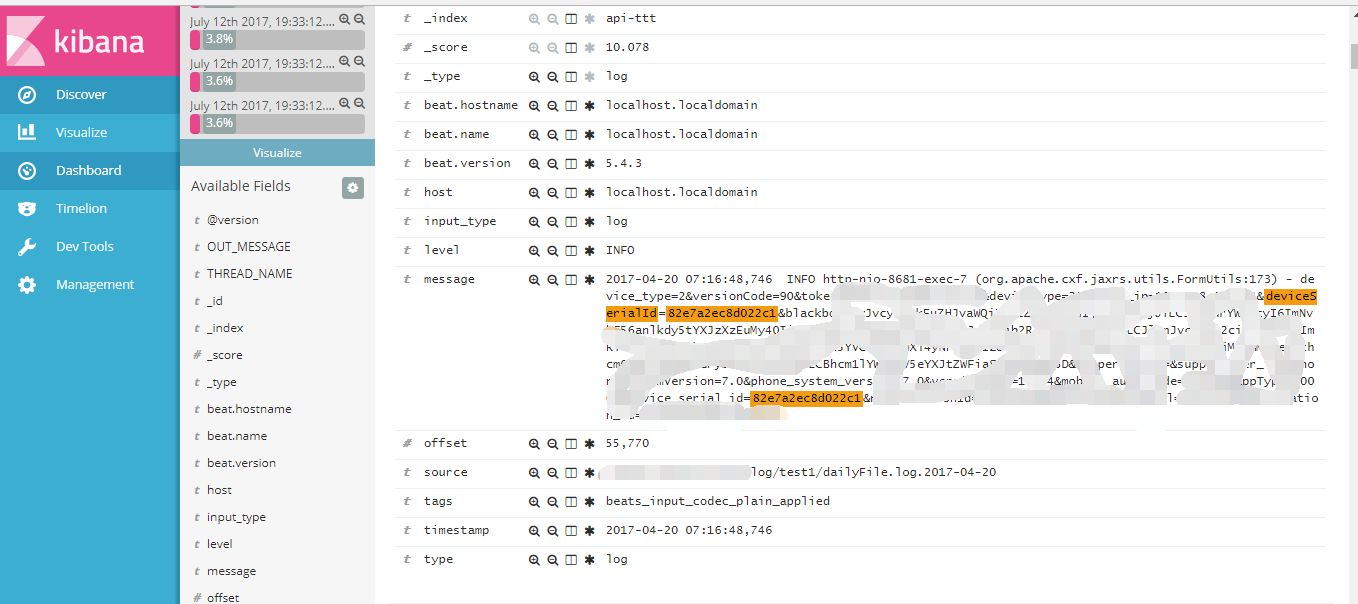
输出结果
8.总结
经过这两天ELK的初体验之旅,只是简单的定位日志,目前个人能想到还有些许数据分析功能还有待折腾…